FFMI Calculator: How to Read Your Fat-Free Mass Index
An FFMI calculator turns your weight, height and body fat into one number: how much lean mass you carry for every square metre of height. Put in 85 kg at 15% body fat and 180 cm and you get 22.3. What that number can and can’t tell you is the harder part.
This guide covers the formula, the height adjustment, what counts as a good score and where the famous 25 line came from. Every figure comes from our FFMI calculator or from the papers behind it. By the end you’ll know how to read a normalized FFMI, why a three-point body fat miss matters, and which claims to take with salt.
- FFMI = fat-free mass (kg) ÷ height (m)². For 85 kg at 15% body fat and 180 cm, that’s 72.25 kg ÷ 3.24, or 22.3.
- The normalized version adds 6.1 × (1.8 − height in m). It does nothing at 180 cm and adds 0.6 at 170 cm.
- Young Swiss adults had median FFMIs of 18.9 (men) and 15.4 (women). The 74 nonusers in Kouri’s study topped out at 25.0.
- Being three body fat points off moves the adjusted result by about 0.8. The input matters more than the formula.
- No FFMI can prove someone is natural or not. Kouri’s own paper called its findings preliminary.
What does an FFMI calculator measure?
FFMI stands for fat-free mass index. Fat-free mass is everything in you that isn’t fat. That includes muscle, but also bone, water and organs. Divide it by your height squared and you get an index, the same shape of sum as BMI with the fat taken out first.
The difference shows up fast. Our 85 kg, 180 cm example has a BMI of 26.2 and an FFMI of 22.3. BMI sees one lump of weight. FFMI at least asks how much of it is fat, which is why we think it’s the better number for lifters.
An FFMI calculator needs three things: weight, height and body fat percentage. You can measure the first two in a minute. The third is the weak link, and we’ll get to it. Our view: the best use of the number is watching your own FFMI move over months, not scoring yourself against strangers. If you want to go straight to the sum, the free FFMI calculator does it in one step.
How do you work out normalized FFMI?
Start with fat mass, which is weight times body fat. Take it off your weight and you have fat-free mass. Then divide by height in metres, squared.
Here’s the 85 kg example. Fat mass is 12.75 kg, so fat-free mass is 72.25 kg. Height squared is 3.24. The FFMI is 22.3. At exactly 1.8 m the correction is zero, so the normalized number is 22.3 as well.
Why bother with a second number? Kouri and colleagues scaled every athlete to a 1.80 m man so people of different heights could share one scale. Keep the same 72.25 kg of lean mass but stand at 170 cm and you get 25.0 raw and 25.6 normalized.
Our tool labels this one the height-adjusted FFMI. It’s the same normalized number from the paper. Here’s the pattern for one fixed amount of lean mass.
| Height | FFMI | Normalized FFMI |
|---|---|---|
| 160 cm | 25.4 | 26.6 |
| 170 cm | 22.5 | 23.1 |
| 180 cm | 20.1 | 20.1 |
| 190 cm | 18.0 | 17.4 |
| 200 cm | 16.3 | 15.0 |
One wrinkle. The paper’s abstract gives the constant as 6.3, while the formula as printed in Todd’s critique, and in most calculators, uses 6.1. We use 6.1. Between 160 and 200 cm the two differ by at most 0.04, which won’t change anything you’d act on. A normalized FFMI is a tidy way to compare people. It adds nothing for one person tracking themselves, since your height isn’t changing. Our view: watch the raw number.
What is a good FFMI?
It depends on who you’re asking about. For the general population, the best numbers we’ve found come from Schutz and colleagues, who measured 5,635 adults in Switzerland. Among 18 to 34 year olds the median was 18.9 for men and 15.4 for women. That’s the middle of ordinary people, not a goal.
A second paper from the same group, with the same 2,986 men and 2,649 women, came out in 2003. Within the normal BMI range it found FFMI values of 16.7 to 19.8 in men and 14.6 to 16.8 in women. Anything above those bands is more lean mass per square metre than the normal-BMI adults in that sample carried.
For people who train, we haven’t found a clean, published figure for what’s typical, so we won’t invent one. Measure yourself against your own starting point. Our view: a good FFMI is one that’s higher than it was last spring, measured the same way each time.
An FFMI chart men can read
This is an FFMI chart men can check, because every row comes from a paper you can open.
| Reference point | FFMI | Source |
|---|---|---|
| Median, men aged 18 to 34 | 18.9 | Schutz et al., 2002 |
| Normal-BMI range, men | 16.7 to 19.8 | Kyle et al., 2003 |
| Highest nonuser (normalized) | 25.0 | Kouri et al., 1995 |
| Mr. America winners, 1939 to 1959 (mean, estimated) | 25.4 | Kouri et al., 1995 |
| Some steroid users | above 30 | Kouri et al., 1995 |
Those last three rows are the famous ones. They come from a small sample of male athletes recruited at gyms, and the Mr. America figure is the authors’ estimate, not a measurement. In our view, an FFMI chart men pass around without a source is just a picture with numbers on it. The red zone on the calculator’s scale starts at 25.0 for that reason. It marks the top of one study’s nonusers. It isn’t a rule.
Is 25 the FFMI natural limit?
An FFMI natural limit sounds like settled science. The number mostly traces back to one paper. Kouri, Pope, Katz and Oliva published it in the Clinical Journal of Sport Medicine in 1995. They calculated FFMI for 157 male athletes, 83 steroid users and 74 nonusers. The normalized values of the nonusers extended up to 25.0, and many users went past it. Some went past 30.
The authors called the findings preliminary. They suggested FFMI as a first screen for possible steroid abuse, not a verdict.
Then the number took on a life of its own. Jan Todd, writing in Iron Game History in 2008, pointed out that Pope’s own estimate put the 1947 Mr. America, Steve Reeves, at 25.7. Her bigger complaint was the history. She argued Pope built the index on historical assumptions that are simply incorrect. On the other side, Eric Helms quoted the authors’ own reasoning in 2014: many nonusers clustered just below 25, so they couldn’t all have been lying.
So you have a small, careful study, a critic who says the benchmark is shaky, and a defence that says the ceiling is plausible anyway. Our view: 25 is a landmark, not a wall.
What about FFMI for women?
The arithmetic is identical. The reference points aren’t. Kouri’s athletes were all men, so the 25.0 line has no equivalent for women, and the FFMI calculator page shows no such line for them. What we can offer is the Swiss median of 15.4 for women aged 18 to 34, plus the 14.6 to 16.8 range for normal BMI.
Treat FFMI for women as a way to follow your own trend. The median describes ordinary young adults, so sitting above it says little about training. We haven’t found a published ceiling for women to compare against. That’s a gap in the research, not in you. Our view: use the median as a reference and your own trend as the measure.
How much does a wrong body fat number change your FFMI?
More than the height correction ever will. Everything in an FFMI calculator hangs on body fat, and body fat estimates are rough. Take the 85 kg, 180 cm example. At 15% the normalized FFMI is 22.3. Call it 18% instead and it drops to 21.5. That’s a gap of 0.8 from a three-point miss.
| Body fat entered | Fat-free mass | FFMI (normalized) |
|---|---|---|
| 12% | 74.8 kg | 23.1 |
| 15% | 72.25 kg | 22.3 |
| 18% | 69.7 kg | 21.5 |
| 21% | 67.15 kg | 20.7 |
| 24% | 64.6 kg | 19.9 |
Our body fat percentage calculator says its Navy method has a standard error of roughly 3 to 4 percentage points, which is exactly the size of miss that moves the result. Use one method, one time of day, and don’t compare a tape-measure reading with a bathroom scale reading. Our view: consistency beats accuracy here. If the error is the same every time, the trend still holds. Our body fat guide goes through the methods.
How to use our FFMI calculator
The tool takes about half a minute once you have the three numbers.
Enter your weight, height and body fat to get your FFMI and the height-adjusted number, placed on a scale. Free, no sign-up.
Open the calculator- Choose metric or imperial.
- Pick male or female. It sets the reference lines on the scale.
- Enter your body weight and height.
- Add your body fat percentage. If you’re not sure of it, use the body fat tool first.
- Press the button and read both numbers. The red dot is your height-adjusted FFMI and the white ring is the raw one.
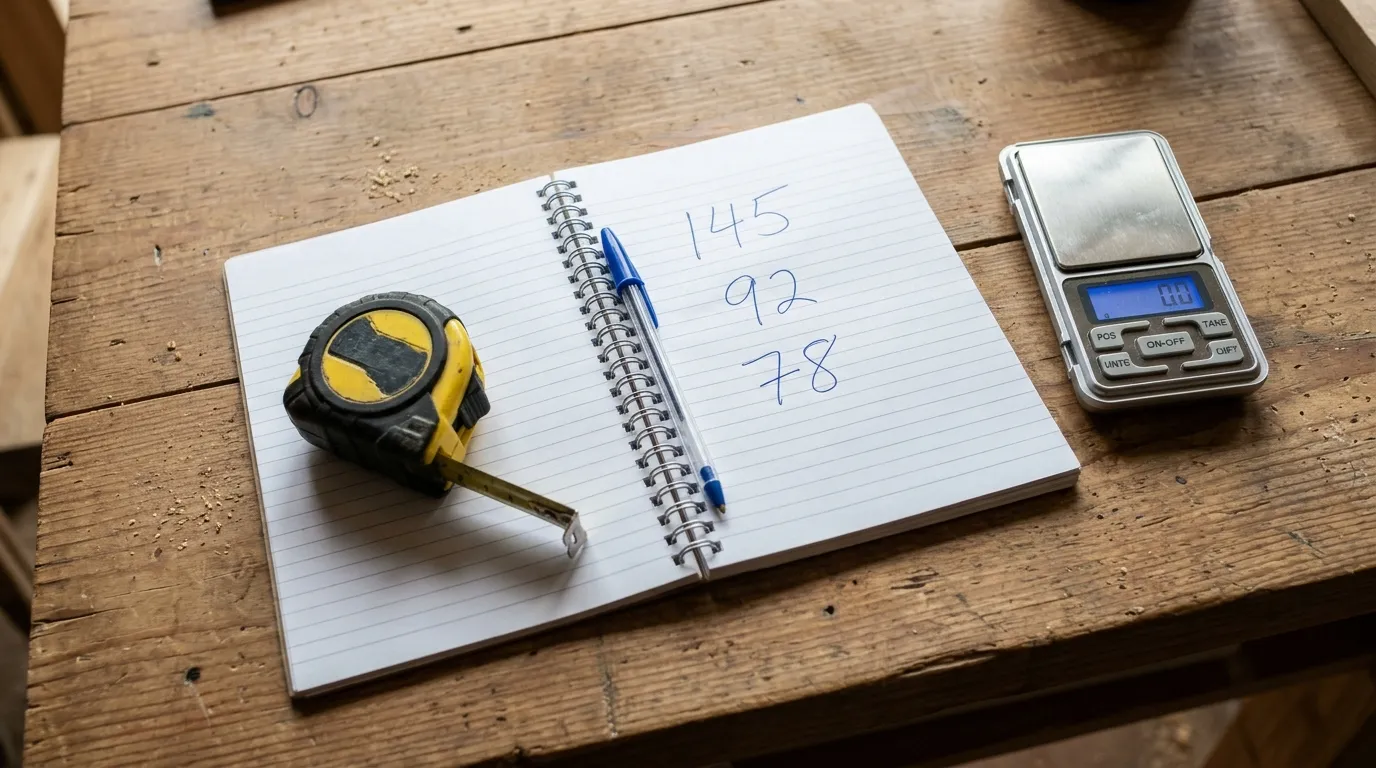
The scale below the numbers is where your height-adjusted FFMI gets context. It places you against the Swiss median and, for men, against the 25.0 line. For a first look, run it twice, once with your best body fat guess and once three points higher, and see how far the result moves. In our view the second run tells you more than the first.
Which FFMI mistakes cost you the most?
Most disputes about an FFMI calculator come down to a few slips.
- Guessing body fat and then trusting the answer to a decimal place.
- Comparing a normalized FFMI with someone else’s raw one.
- Treating 25 as a pass-or-fail line for an individual.
- Mixing body fat methods between check-ins.
- Reading fat-free mass as pure muscle. Bone, water and organs are in there too.
- Weighing yourself after a big meal one month and fasted the next.
In our view the first one is the easiest to make, since the calculator hands back a tidy number whatever you feed it.
Frequently asked questions
What is a good FFMI?
That depends on who you're comparing yourself with. Young Swiss adults had medians of 18.9 for men and 15.4 for women. For a lifter, the most useful comparison is your own number from six months ago.
Is an FFMI of 25 the natural limit?
It's a landmark from one sample. The 74 nonusers in Kouri's 1995 study topped out at 25.0, but the authors called their findings preliminary, and Jan Todd's 2008 critique challenged the history behind the benchmark. Read the paper before you quote it.
What's the difference between FFMI and normalized FFMI?
Raw FFMI is fat-free mass divided by height squared. The normalized version adds 6.1 for every metre you're under 1.8 m and takes it off for every metre over. To track your own progress, use the raw one.
How accurate is an FFMI calculator?
Only as accurate as the body fat figure you give it. In our 85 kg example, three points of error moves the adjusted result by about 0.8.
Does an FFMI calculator work for women?
The maths does. The 25.0 line doesn't carry over, since Kouri's athletes were all men, so for women we show only the 15.4 median from the Swiss sample. That's context, not a target.
Is the FFMI calculator free?
Yes. You don't need an account or a sign-up, and everything runs in your browser, so nothing you type is stored.
What I’d actually do
Say you’re 78 kg, 175 cm, and your best guess is 14% body fat.
Fat mass: 78 × 0.14 = 10.92 kg. Fat-free mass: 67.08 kg. Height squared is 3.0625.
FFMI is 21.9. Normalized, 22.2.
That’s 3.0 above the Swiss young-male median of 18.9. Useful context, nothing more.
Now be fair to the body fat guess. If the truth is 17%, the same maths gives 21.1 raw and 21.4 normalized. So I’d write down the range, 21.4 to 22.2, and not pretend to a single figure.
Reaching a normalized 25.0 at 175 cm takes an FFMI of 24.7, which is 75.6 kg of fat-free mass. That’s about 8.5 kg more than today. It’s a large gap, and the number itself can’t say whether you’ll close it.
So I’d skip the chase. Measure body fat the same way every four to eight weeks, log the raw FFMI, and judge the trend over six months. Run your own figures through the FFMI calculator for lifters, and if you’re feeding the gains, our protein calculator is the next stop. More tools sit in our body composition tools.
If you’d rather have a whole month laid out for you, you can grab the $27 30-Day Reset program from our sister site Bodylix.